
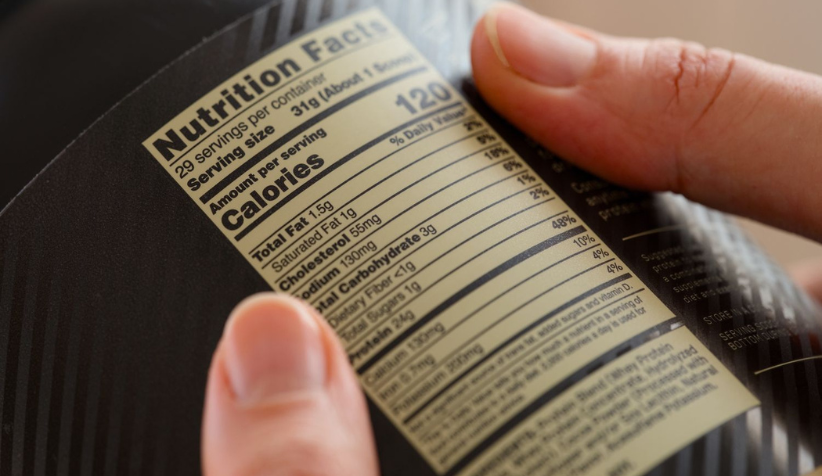
Ask anyone in food development how good a protein-enriched product is, and the first answer is often a number. Twelve grams per serving. Twenty. Thirty. It is a reasonable place to begin. Protein content is measurable, comparable, and required on nutrition labels in many markets.
But it is a narrower measurement than it looks. Protein content is commonly estimated from the total nitrogen in a food using a nitrogen-to-protein conversion factor. A general factor of 6.25 is widely used when a food-specific factor is not available, although FAO notes that the nitrogen content of proteins varies and that food-specific conversion factors can produce different values. The resulting figure is therefore a calculated measure of protein content, not a direct measurement of the food’s amino acid composition or protein quality.
That points to a less obvious question than the familiar debates about animal versus plant, or high versus low. If two foods declare the same amount of protein, have they necessarily delivered the same nutritional value? And if one declares considerably more, does that automatically make it the better food?
The research gives a qualified answer. Protein quantity matters, but it is only one part of the nutritional picture. The amino acids that make up the protein, their digestibility, the amount that is available for absorption, and the composition of the food around the protein can all influence what that number means.
What the Number Counts
Dietary protein provides amino acids, including nine indispensable amino acids that humans cannot synthesize in sufficient amounts and therefore need to obtain from the diet. Protein quality assessment therefore looks beyond total protein and considers both the amino acid pattern and digestibility. The FAO’s protein-quality framework specifically recommends treating indispensable amino acids as individual nutrients when evaluating protein quality.
The difference can be seen in controlled feeding studies. In one small trial, nine healthy young men consumed 0.33 grams of protein per kilogram of body weight from whey, pea, or fava bean protein isolate. The proportion of indispensable amino acids differed between the isolates, and the post-meal increase in circulating indispensable amino acids was greater after whey than after pea or fava protein under the conditions tested.
That was a small, single-dose study, and it does not establish that pea or fava protein is nutritionally inadequate. It demonstrates something narrower: two protein sources supplied at the same nominal protein dose can deliver different amounts and patterns of indispensable amino acids, which can produce different post-meal amino acid responses.
Grams Are Not Interchangeable
Protein quality assessment begins with the amino acid pattern. A protein is compared with a reference pattern of indispensable amino acid requirements, and the amino acid present in the smallest proportion relative to that reference can become the limiting amino acid. A protein can contain adequate amounts of several indispensable amino acids while still being limited by another.
The limiting amino acid varies between protein sources. Cereal proteins are commonly limited by lysine, while many legume proteins have lower proportions of the sulfur-containing amino acids methionine and cysteine relative to reference patterns. The exact score, however, depends on the protein, the reference pattern used, and the method of assessment.
This is one reason complementary protein sources have long been discussed in nutrition science. Combining sources with different limiting amino acids can produce a more balanced amino acid pattern than either source considered alone. FAO’s framework also recognizes that protein quality needs to be considered in the context of diets rather than only isolated ingredients.
That does not make a lower-scoring protein a poor food. It means that a protein-quality score answers a narrower question: how well does that protein, considered under the conditions of the assessment, supply indispensable amino acids relative to a defined reference pattern?
Digestion Changes the Calculation
An amino acid profile tells us what is present in the protein. Digestibility tells us how much of those amino acids become available at the site of absorption. Protein-quality methods therefore account for both amino acid composition and digestibility.
Two widely discussed systems are PDCAAS and DIAAS. PDCAAS uses a corrected amino acid score based on protein digestibility, with the final score truncated at 1.0. DIAAS was introduced by the FAO as an alternative that uses true ileal digestibility of individual indispensable amino acids and does not truncate values above 1.0. The distinction matters because digestibility can differ between individual amino acids, and measurements taken later in the gastrointestinal tract can be influenced by microbial metabolism.
FAO recommended DIAAS as the preferred approach for protein-quality assessment, while also identifying the need for additional data on human amino acid requirements, true ileal amino acid digestibility, processing effects, and lysine bioavailability. A 2024 review by Moughan and Lim similarly concluded that DIAAS is currently the most accurate score available for routinely assessing single-source protein quality, while noting areas where the method could still be improved.
The numbers can also change with the material being tested. Published DIAAS values differ between protein ingredients, and results obtained in animal models cannot simply be treated as equivalent to measurements obtained directly in humans. This is why a protein-quality value should always be interpreted alongside the ingredient tested, the reference pattern, the digestibility method, and the population to which the result is being applied.
Human data illustrate the point. In a randomized trial using direct ileal measurements, pea protein and casein had mean true ileal nitrogen digestibilities of 92.0% and 94.0%, respectively, with no statistically significant difference in nitrogen digestibility. Some individual amino acids were less digestible from pea protein, and the calculated DIAAS values differed between the two proteins.
The study does not establish that one protein is universally better than the other. It shows that overall nitrogen digestibility and individual amino acid digestibility are not necessarily identical measures, and that protein-quality assessment can produce different information depending on what is being measured.
Scores Have Limits Too
DIAAS is useful precisely because it captures more information than protein quantity alone. But it is still a protein-quality measure, not a complete measure of the nutritional quality of a food or diet.
A score is calculated against a defined amino acid reference pattern and digestibility data. It does not, by itself, describe the fibre, vitamins, minerals, fatty acids, energy density, sodium, sugars, or other components of the food in which that protein is consumed. Nor does a single protein-quality score predict the long-term health effects of a complete dietary pattern.
The distinction matters because protein is consumed as part of foods and meals, not as an isolated laboratory score. A protein ingredient can have a particular amino acid profile and digestibility while the finished food contributes many other nutrients that also influence its overall nutritional value.
That does not make protein-quality measurements less useful. It defines what they can reasonably be used for: comparing protein quality under specified conditions rather than declaring an entire food or diet nutritionally superior.
The Food Around the Protein
Protein is not consumed in isolation. It is consumed as part of a food matrix, alongside the other nutrients and components that determine the food’s overall nutritional composition.
Market data illustrate why that distinction matters. A 2024 study of 4,325 processed foods in the Spanish market found that 561 products, or 13%, carried a protein claim. Of those products with protein claims, 60.4% were classified as protein-fortified. Using the Pan American Health Organization nutrient-profile model, 90.8% of products carrying protein claims were classified as “less healthy” under that particular model. More than half were high in fat or sodium, while the proportion classified as high in free sugar or saturated fat was lower among products with protein claims.
Those numbers describe the composition of a specific market sample. They do not show that protein claims cause poorer nutritional quality, nor do they establish what happens to the diets or health of people who consume those products. The study does show that the presence of a protein claim does not, by itself, describe the overall nutrient profile of a processed food.
A similar pattern appeared in a 2025 analysis of breakfast cereals sold in Sydney. Cereals with added protein had the same median Health Star Rating(4.0 stars) as cereals without added protein, while also containing higher median amounts of sodium and total sugars. The study was cross-sectional and specific to breakfast cereals available in Sydney in 2024, so it cannot be generalized to all high-protein foods.
The point is not that adding protein makes a food less nutritious. It is that increasing one nutrient does not automatically improve every other aspect of the formulation.
What Happens Inside a Formulation
Raising protein in a product is not simply a matter of increasing a number. Changing protein concentration can alter the physical properties of a food, and the effect depends on the protein, the food matrix, the processing conditions, and the level of incorporation.
Extrusion provides a clear example. In a 2024 study of pea-protein-enriched corn puffs, increasing protein content altered extrusion behaviour and product structure. The researchers also found that nitrogen-gas injection could improve expansion and some texture properties at particular protein concentrations. The study tested formulations containing up to 50% protein, but it was a controlled model system rather than a general demonstration that all high-protein products become harder or less acceptable.
Storage introduces another layer. Protein ingredients can undergo chemical and physical changes during processing and shelf life. These can include oxidation, protein aggregation, Maillard reactions, moisture migration, and changes in microstructure. The relative importance of each mechanism depends on the formulation and storage conditions.
A model protein-bar study reported that reactive lysine decreased by 38% during the first ten days of storage. The same study also found substantial changes in texture and molecular mobility, while its data suggested that moisture-related structural changes played an important role in hardening. Reactive lysine loss is relevant because lysine can participate in Maillard reactions and its nutritional availability can be reduced when it becomes chemically modified.
More recent work comparing pea, whey, and rice protein bars found that all three formulations hardened during accelerated storage, with differences in the rate of hardening. The study also detected protein oxidation, protein aggregation, and Maillard-reaction-related protein modifications, with the extent varying between protein types. These findings are specific to the experimental formulations and storage conditions; they do not establish that one protein type will always have better shelf-life performance than another.
This is where the number on a nutrition panel becomes an incomplete description of formulation performance. The declared protein content may remain the same while the physical, chemical, and nutritional properties of the product change during processing and storage.
A Better Question for Protein Ingredients
Taken together, the evidence changes what a formulator can usefully ask. “How many grams?” remains an important labelling question. It is simply not the only design question.
Which indispensable amino acid is limiting in this protein? How was its digestibility measured? Which reference pattern was used? What happens to the protein during processing? Could processing alter the availability of reactive amino acids such as lysine? What does increasing protein concentration do to texture, flavour, stability, and the rest of the nutrient composition? And what does the finished food contribute beyond protein itself?
These questions do not replace protein content. They put it into context.
Protein complementarity is one example. A cereal protein that is relatively low in lysine and a legume protein with a different amino acid limitation can contribute complementary amino acid patterns when consumed together. But the nutritional effect of a combination depends on the amounts consumed, the digestibility of the proteins, and the overall diet. It is therefore more accurate to describe complementarity as a tool for improving amino acid balance than as a guarantee of a particular nutritional outcome.
The evidence also does not support treating “plant protein” or “animal protein” as single nutritional categories. Protein quality varies substantially within both groups, and values depend on the specific ingredient, processing history, reference pattern, and measurement method. Human studies have also shown that some plant protein isolates can have high measured digestibility and protein-quality values under defined experimental conditions.
That leaves the number on the panel in a more modest position. It remains useful. It tells us how much protein the product contains according to the applicable analytical and regulatory method. But it does not, by itself, tell us the amino acid pattern, digestibility, processing history, or overall nutritional composition of the food.
At OMN9, these are the questions that shape how we think about protein ingredients: not only how much protein an ingredient contributes, but which amino acids it supplies, how its properties behave through processing, how it performs at the inclusion level required by a formulation, and what happens when it is combined with the rest of the food. Most pulse proteins have amino acid patterns in which the sulfur-containing amino acids are relatively limiting compared with reference patterns, so we view them as components of a nutritional system rather than as isolated answers.
More protein can be useful. But a higher number is only the beginning of the question.
← How Climate Change Could Change the Nutritional Quality of Our Food
As protein-enriched foods continue to evolve, understanding protein quality alongside protein quantity will become increasingly important for formulators. Looking beyond grams of protein can help inform ingredient selection, formulation decisions, and the nutritional performance of the finished product. At OMN9, we work with food manufacturers to advance Mung Bean Protein Isolate 80%, exploring how amino acid composition, functionality, processing, and formulation can come together to develop scalable plant-based protein solutions.
Connect with us to explore how mung bean protein can support your next formulation while building protein systems designed around more than just the number on the label.
1. Moughan, P. J., & Lim, W. X. J. (2024). Digestible indispensable amino acid score (DIAAS): 10 years on. Frontiers in Nutrition, 11, 1389719. doi:10.3389/fnut.2024.1389719
https://doi.org/10.3389/fnut.2024.1389719
2. Herreman, L., Nommensen, P., Pennings, B., & Laus, M. C. (2020). Comprehensive overview of the quality of plant- and animal-sourced proteins based on the digestible indispensable amino acid score. Food Science & Nutrition, 8(10), 5379–5391. doi:10.1002/fsn3.1809
https://doi.org/10.1002/fsn3.1809
3. Mathai, J. K., Liu, Y., & Stein, H. H. (2017). Values for digestible indispensable amino acid scores (DIAAS) for some dairy and plant proteins may better describe protein quality than values calculated using the concept for PDCAAS. British Journal of Nutrition, 117(4), 490–499.
https://doi.org/10.1017/S0007114517000128
4. Guillin, F. M., Gaudichon, C., Guérin-Deremaux, L., Lefranc-Millot, C., Airinei, G., Khodorova, N., Benamouzig, R., Pomport, P.-H., Martin, J., & Calvez, J. (2022). Real ileal amino acid digestibility of pea protein compared to casein in healthy humans: A randomized trial. The American Journal of Clinical Nutrition, 115(2), 353–363. doi:10.1093/ajcn/nqab354
https://doi.org/10.1093/ajcn/nqab354
5. Guillin, F. M., et al. (2024). Values for the digestibility of pea protein isolate or casein amino acids determined using the dual isotope method are not similar to those derived with the standard ileal balance method in healthy volunteers. The Journal of Nutrition, 154(2), 516–525. doi:10.1016/j.tjnut.2023.12.039
https://doi.org/10.1016/j.tjnut.2023.12.039
6. Nosworthy, M. G., Medina, G., Franczyk, A. J., Neufeld, J., Appah, P., Utioh, A., Frohlich, P., & House, J. D. (2018). Effect of processing on the in vitro and in vivo protein quality of red and green lentils (Lens culinaris). Food Chemistry, 240, 588–593. doi:10.1016/j.foodchem.2017.07.129
https://doi.org/10.1016/j.foodchem.2017.07.129
7. An investigation of the protein quality and temporal pattern of peripheral blood aminoacidemia following ingestion of 0.33 g·kg⁻¹ body mass protein isolates of whey, pea, and fava bean in healthy, young adult men. Nutrients.
https://pmc.ncbi.nlm.nih.gov/articles/PMC10574361/
8. Nudel, A., & Kerem, Z. (2026). From single foods to whole diets: A critical framework for protein quality assessment accounting for complementarity and matrix effects. Comprehensive Reviews in Food Science and Food Safety, 25(4), e70571. doi:10.1111/1541-4337.70571
https://doi.org/10.1111/1541-4337.70571
9. Matthews, J. J., Arentson-Lantz, E. J., & Moughan, P. J. (2025). Understanding dietary protein quality: Digestible indispensable amino acid scores and beyond. The Journal of Nutrition, 155(10), 3152–3167. doi:10.1016/j.tjnut.2025.07.005
https://doi.org/10.1016/j.tjnut.2025.07.005
10. Beltrá, M., Borrás, F., & Ropero, A. B. (2024). Are foods with protein claims healthy? A study of the Spanish market. Nutrients, 16(24), 4281. doi:10.3390/nu16244281
https://doi.org/10.3390/nu16244281
11. Zhou, P., Zheng, Y., Kaiser, H. M., et al. (2026). On-package claims are imperfect signals of overall nutritional quality. Nature Food. doi:10.1038/s43016-026-01435-9
https://doi.org/10.1038/s43016-026-01435-9
12. Protein-enriched breakfast cereals receive similar Health Star Ratings despite higher sugar and sodium content. (2025). Public Health, 248, 105968. doi:10.1016/j.puhe.2025.105968
https://doi.org/10.1016/j.puhe.2025.105968
13. Loveday, S. M., Hindmarsh, J. P., Creamer, L. K., & Singh, H. (2009). Physicochemical changes in a model protein bar during storage. Food Research International, 42(7), 798–806. doi:10.1016/j.foodres.2009.03.002
https://doi.org/10.1016/j.foodres.2009.03.002
14. Dietrich, R. B., Lincoln, L., Momen, S., Minkoff, B. B., Sussman, M. R., & Girard, A. L. (2025). Role of protein and lipid oxidation in hardening of high-protein bars during storage. Journal of Food Science, 90(1), e17657. doi:10.1111/1750-3841.17663
https://doi.org/10.1111/1750-3841.17663
15. Nitrogen gas-assisted extrusion for improving the physical quality of pea protein-enriched corn puffs with a wide range of protein contents. (2024). Foods.
https://pmc.ncbi.nlm.nih.gov/articles/PMC11311776/
16. Sinaki, N. Y., Masatcioglu, M. T., Paliwal, J., & Koksel, F. (2022). Development of cellular high-protein foods: Third-generation yellow pea and red lentil puffed snacks. Foods, 11(1), 38. doi:10.3390/foods11010038
https://doi.org/10.3390/foods11010038
17. Fu, W., Tanaka, R., & Yano, H. (2026). Antioxidant activity and off-flavor reduction in soy-based high-protein, low-carb spherical snacks. CyTA – Journal of Food, 24(1), 2642506. doi:10.1080/19476337.2026.2642506
https://doi.org/10.1080/19476337.2026.2642506

Innovating the ideal protein from plants
E-19, Agro Food Park, Boranda, Jodhpur 342012
Pusa Krishi, IARI Pusa Campus, Delhi 110012
Phone: +91 291 2979350
Email: info@omn9.com